


Our Q4 2025 data for endowments and foundations shows something important: strong markets can hide structural gaps. Dispersion exposes them.
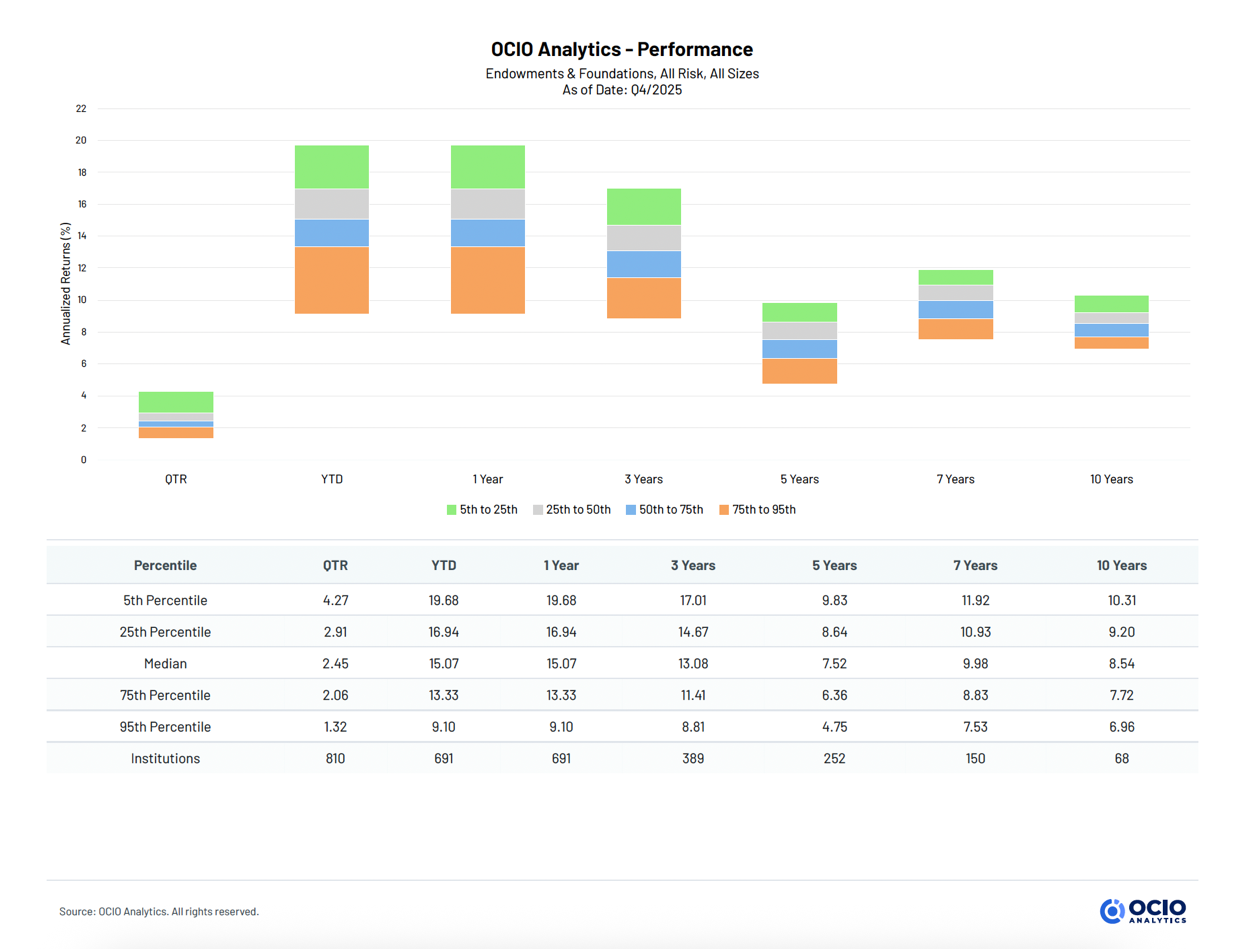
Even in a broadly positive year, the gap between top and bottom performers was nearly 10 percentage points:
For YTD:
- Top 5%: 19.68%
- Median: 15.07%
- Bottom 5%: 9.10%
The questions committees and CIOs should be asking:
- Is our performance cyclical or structural?
- Are we benchmarking to markets or to our peers?
That’s where independent peer analytics can help uncover these insights to drive better long-term decisions.
See how your results compare – book a short demo to learn more.

 Follow Us