Independent Tools Built for the OCIO Industry
Clearer context, stronger evaluation, and better decisions—powered by OCIO industry data.
Institutions Providing
Portfolio Data
Contributing OCIO and
Institutions
Years of
History
Asset
Classes Analyzed
A Comprehensive Platform
We offer a suite of three solutions that provide institutions and their advisors with unique, independent intelligence to benchmark portfolios, evaluate OCIO providers, and strengthen fiduciary reporting through unbiased, data-driven insight.
Request DemoOur Platform Suite
OCIO Analytics
For Asset Owners Investment Teams CIOs OCIOs Consultants
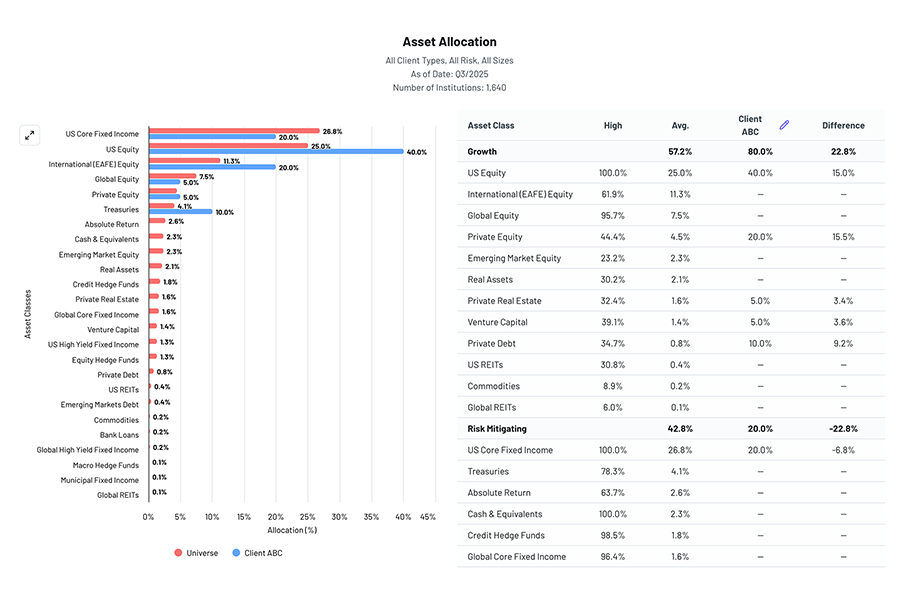
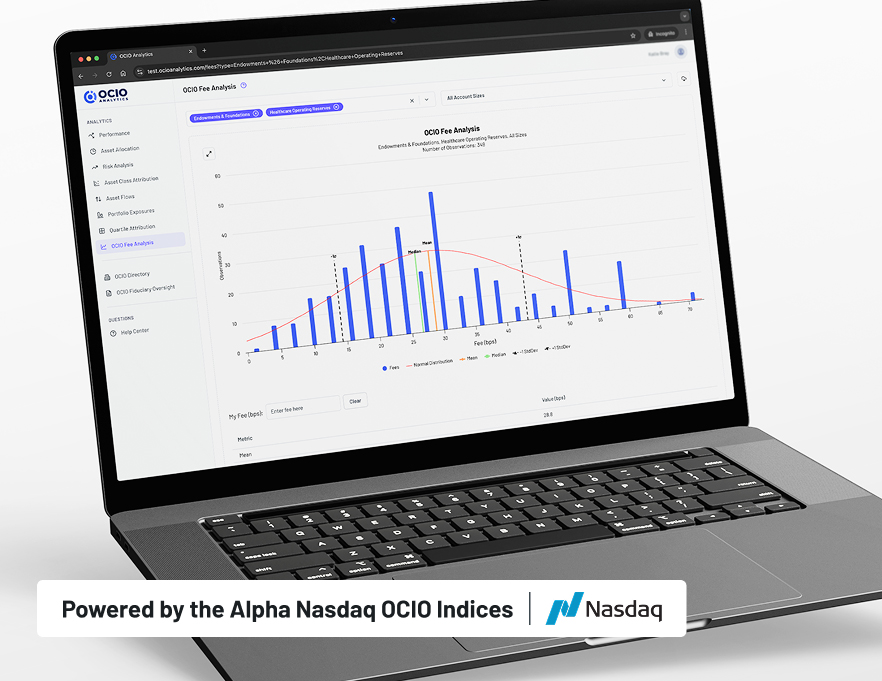
Built on the Alpha Nasdaq OCIO Indices, the industry’s only standardized benchmark for OCIO performance, OCIO Analytics offers eight modules designed to give institutional investors a precise view of their portfolios, bringing clarity and consistency to oversight and investment decision-making.
- Offers a market-wide benchmark framework grounded in independent, standardized OCIO data from over 1,600 institutions
- Customize the universe to instantly see how your portfolio compares to your peers
- Bring clearer, defensible context to strategic investment decisions
OCIO Fiduciary Oversight
For Investment committees Board members Monitoring Governance
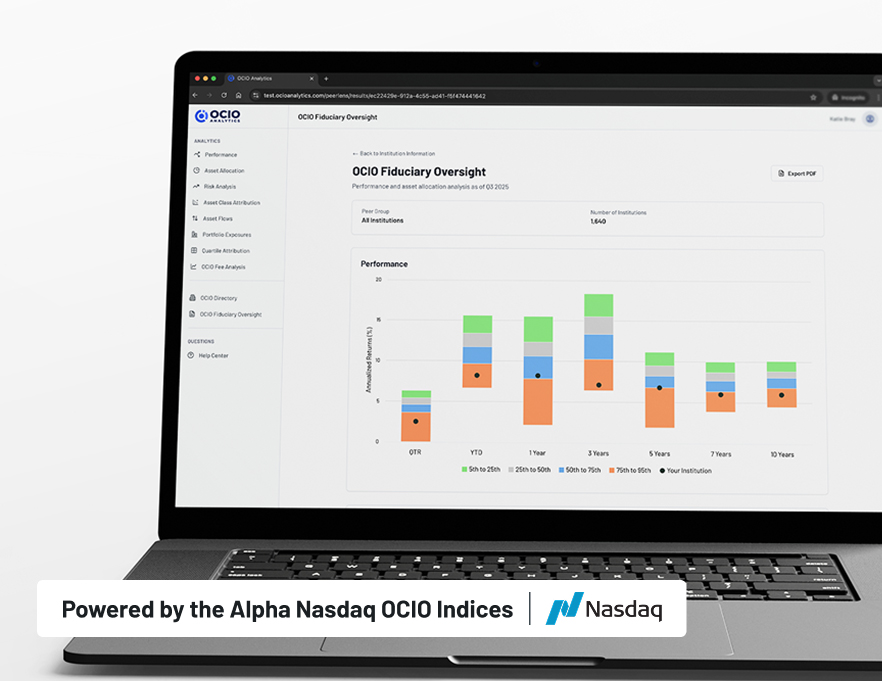
Built from the Alpha Nasdaq OCIO Indices, OCIO Fiduciary Oversight provides a streamlined oversight solution designed to provide quick, focused portfolio insights into how the returns and asset mix stack up across the OCIO industry.
- Get an instant “health check” on how your portfolio’s return and asset mix compare to peers.
- Equips you with clearer oversight questions at board and investment committee meetings
- Delivers committee-ready summaries that support confident, well-documented oversight

OCIO Directory
For Asset Owners Comparing OCIO Providers
The OCIO Directory is a centralized, SEC-sourced catalogue of OCIO providers that brings transparency to the market and helps investors quickly understand and compare firms across key attributes, such as leadership, assets under management, and fees.
- Gives access to standardized, easy-to-compare data across 90+ OCIO providers
- Relies on the credible, independent SEC-sourced data
- Automatically updates weekly
Trusted Across the OCIO Ecosystem
Leading institutions, advisors, and investment firms rely on OCIO Analytics for the insights they need to benchmark portfolios, evaluate providers, and support governance.
Subscription Packages
empty |
Plan Discover
|
Plan Evaluate
|
Plan Premium
|
|---|---|---|---|
Access to OCIO Directory |

|
|
|
Access to OCIO Fiduciary Oversight |

(14-day free trial) |
|
|
Access to OCIO Analytics |
|
(14-day free trial) |
|
Free |
$2,000 /Year |
Contact for Pricing |
|
| Get Free Access | Subscribe Now | Contact Us |

Frequently Asked Questions
What’s included in each subscription tier?
Discover (Free)
Discover provides unlimited access to the OCIO Directory, allowing users to explore OCIO providers, review firm profiles, and understand the competitive landscape. After five uses, users are prompted to register with an email address to continue accessing the Directory.
Evaluate
Evaluate includes everything in Discover, plus full access to OCIO Fiduciary Oversight. This tier is designed for institutions and advisors conducting ongoing provider evaluation, fiduciary monitoring, and reporting.
Premium
Premium includes full access to all OCIO Analytics capabilities, along with OCIO Fiduciary Oversight and unlimited use of the OCIO Directory. This tier supports advanced benchmarking, portfolio analysis, and multi-dimensional OCIO comparisons across all analytics modules.
How does OCIO Analytics compare to the OCIO Directory and Fiduciary Oversight?
The OCIO Directory is designed for discovery—helping users identify, compare, and understand OCIO providers at a high level.
OCIO Fiduciary Oversight supports structured evaluation and monitoring, enabling users to assess providers through a fiduciary lens and support governance and oversight processes.
OCIO Analytics provides the deepest level of insight, offering advanced benchmarking, performance and allocation analysis, and multi-asset comparisons across peer groups. It is built for users who require comprehensive, data-driven analysis to support investment decision-making.
Where does your benchmark data come from, and how often is it updated?
The OCIO Analytics platform draws from the Alpha Nasdaq OCIO Indices, which are based on anonymous account-level performance and allocation data from over 1,600 institutional clients across 50+ leading investment firms, all reported net of fees. The data is updated quarterly.
Bring Clarity to Your Investment Decisions
Request a demo to see how peer benchmarking and OCIO-specific analytics work across the platform.