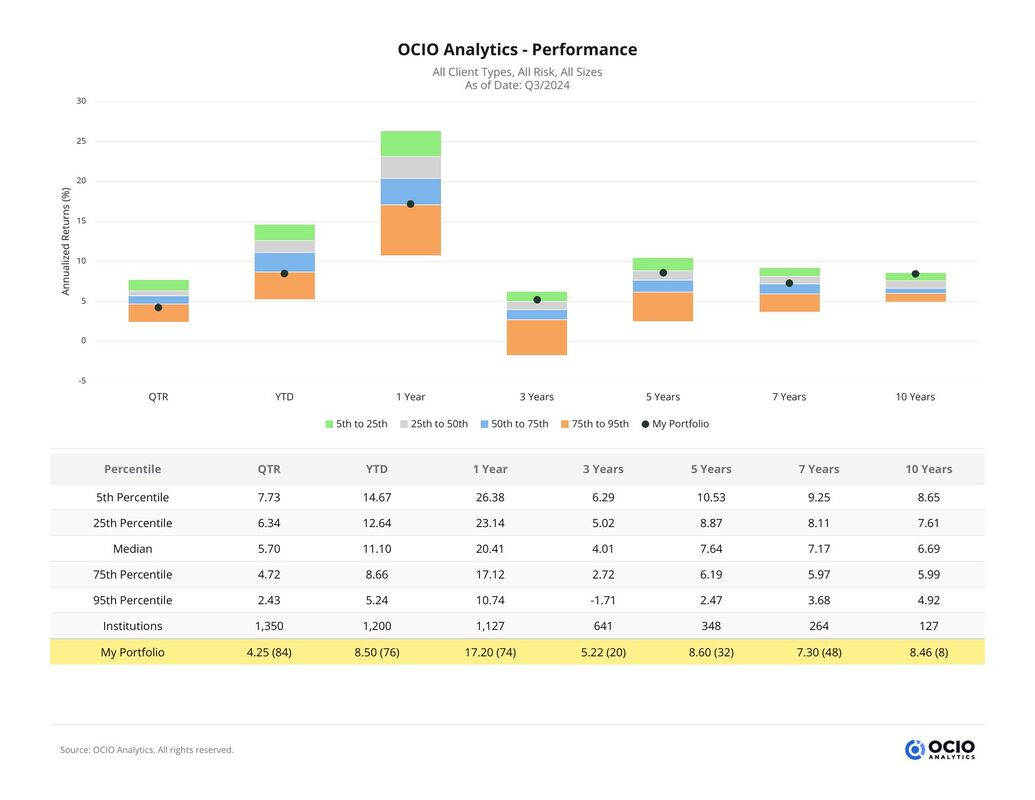
Benchmark institution performance and view percentile rankings against a customizable universe of over 1,600 institutions
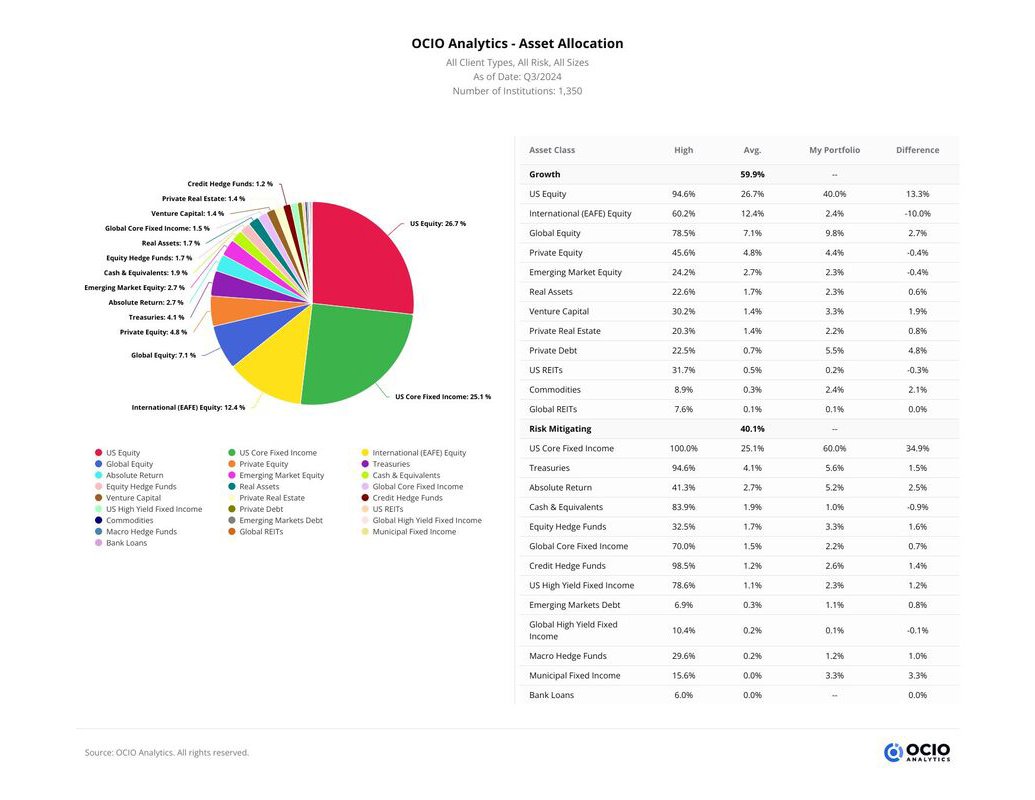
View how your portfolio allocations compare to similar institutions among 25 asset classes that allow for consistent taxonomy
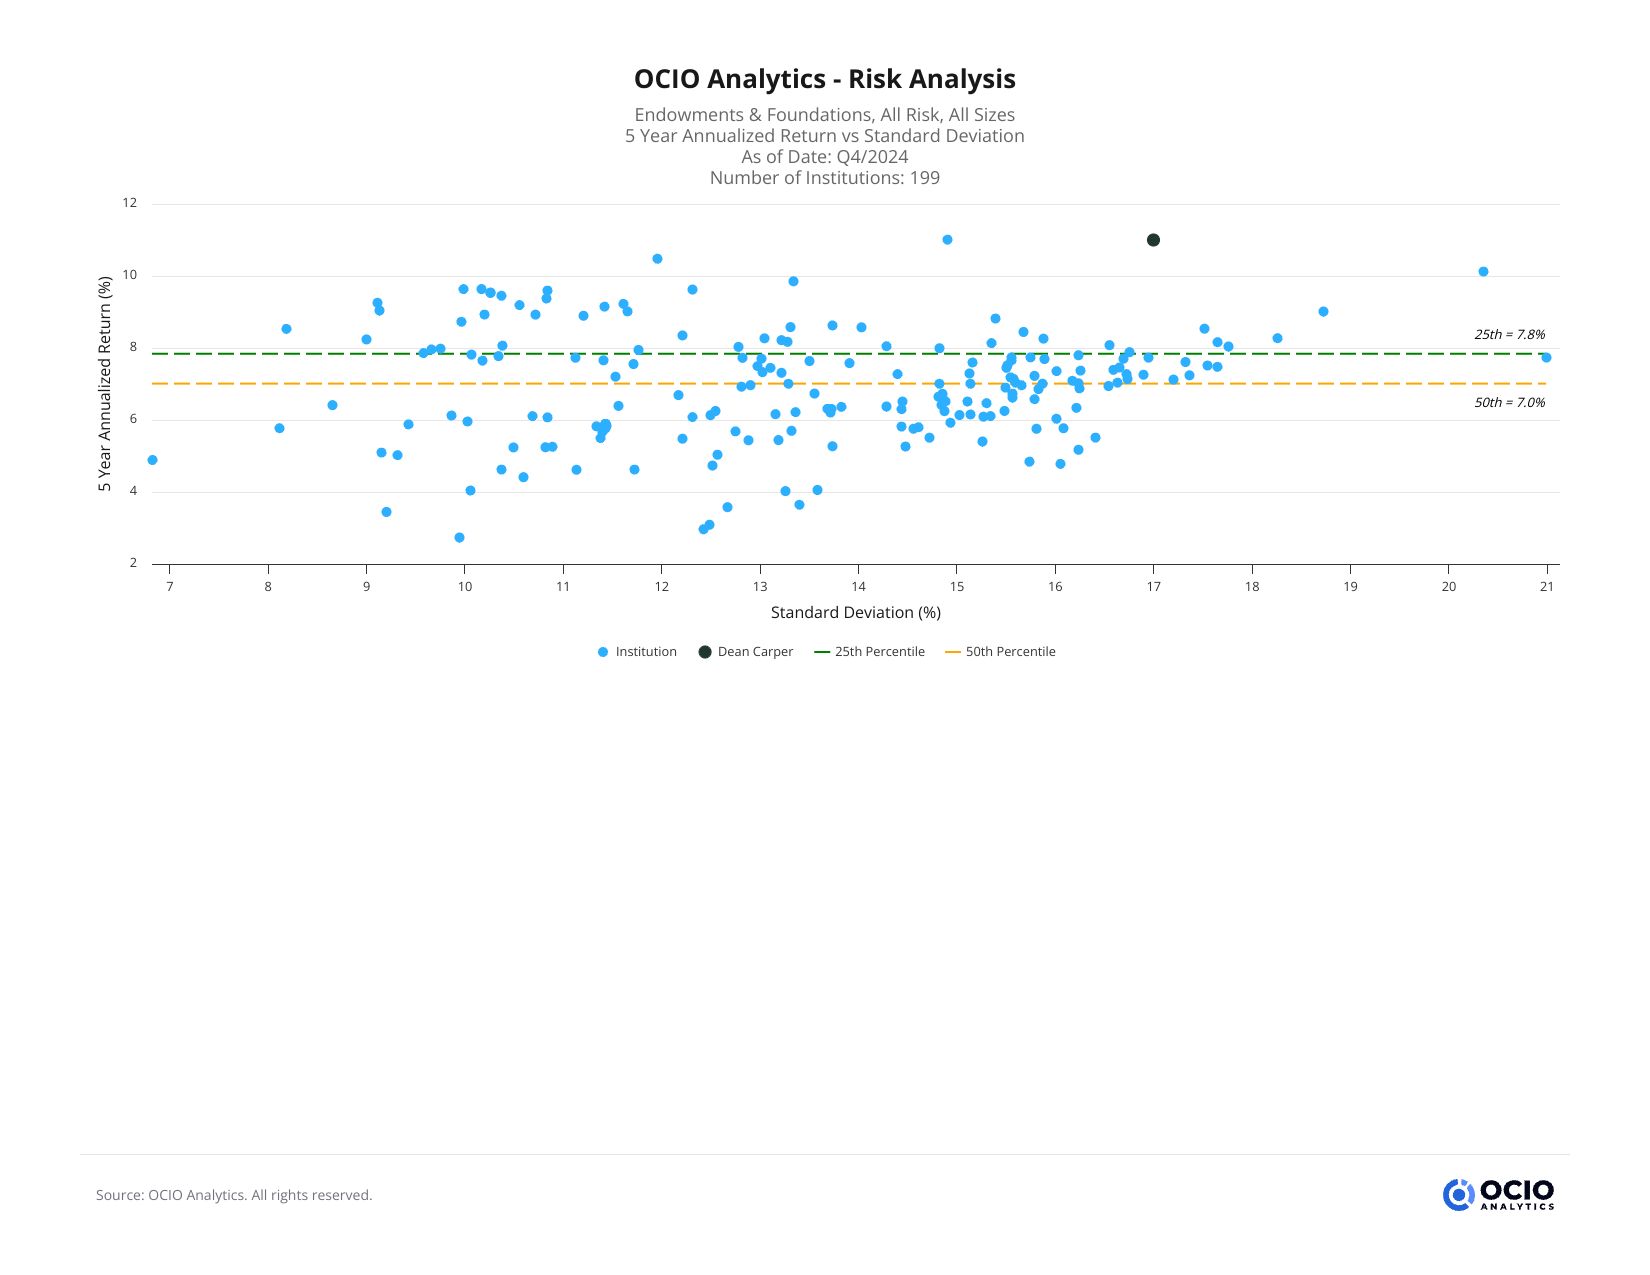
Visualizations that correlate risk with return outcomes and access to individual institution allocation details
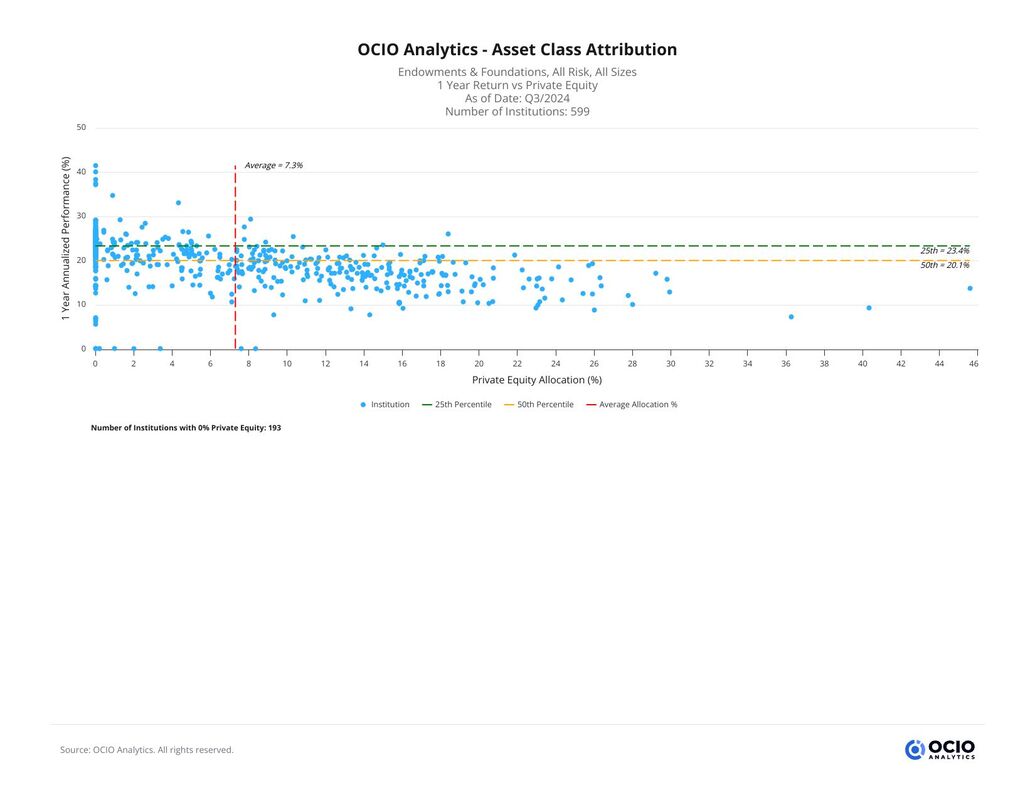
Gain insights on actual institutional returns and discover which asset classes, like private equity, drive portfolio performance
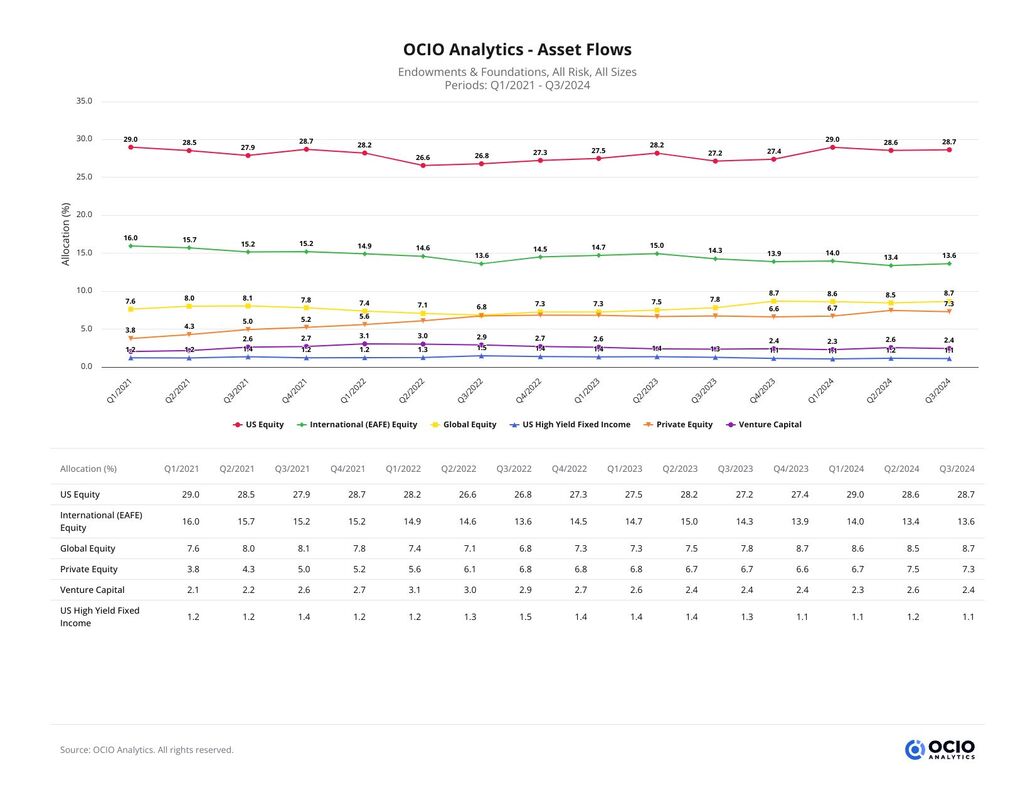
Graph historical and current trend lines for 25 asset classes to view changes or patterns over time
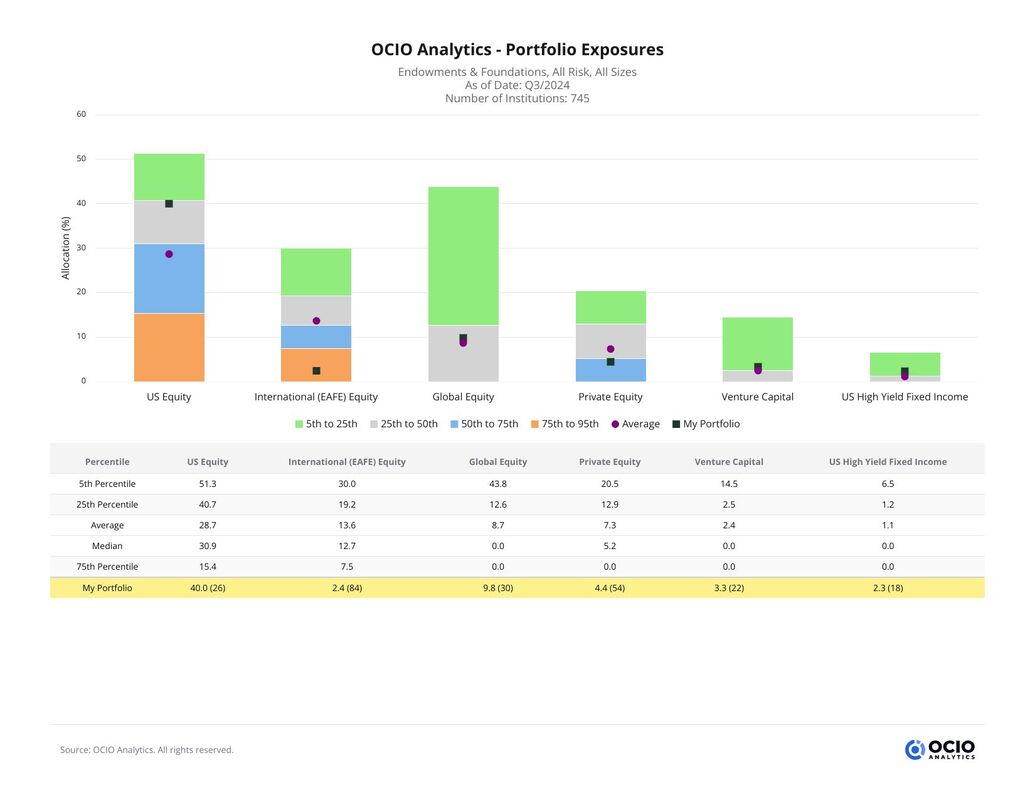
Input your portfolio's asset allocation to see your portfolio exposures across 25 asset classes by quartile breakdown and average as compared to the OCIO industry
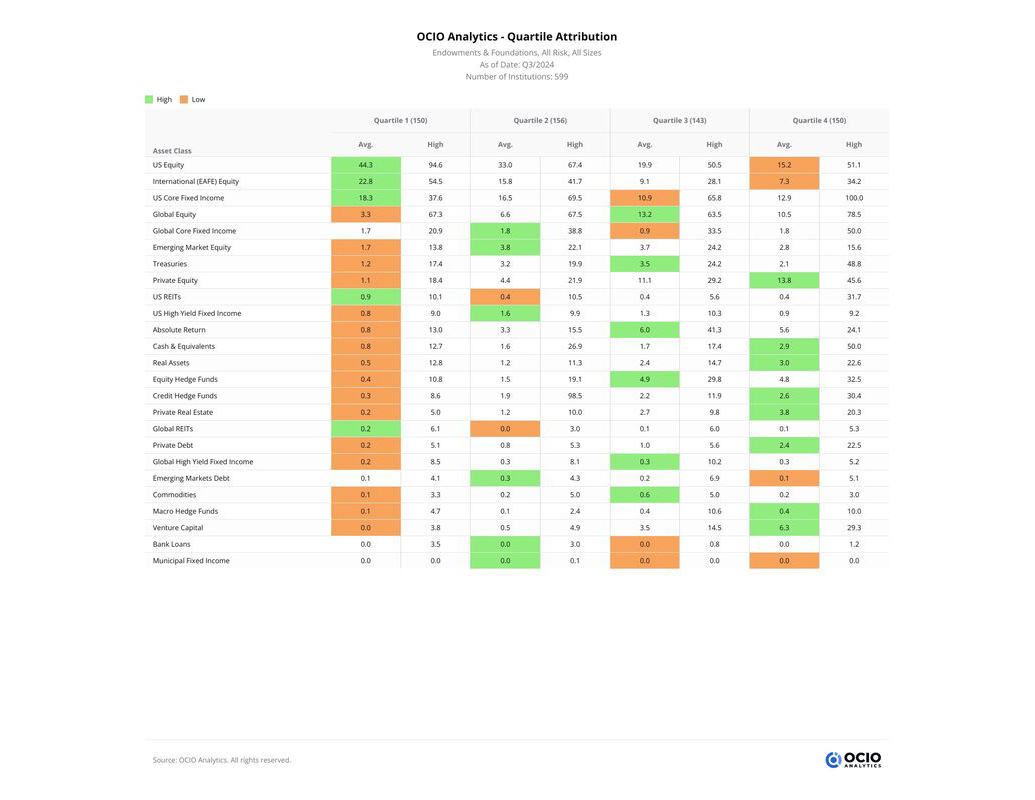
Break down any peer universe into four performance quartiles and further analyze the asset class attribution across time periods
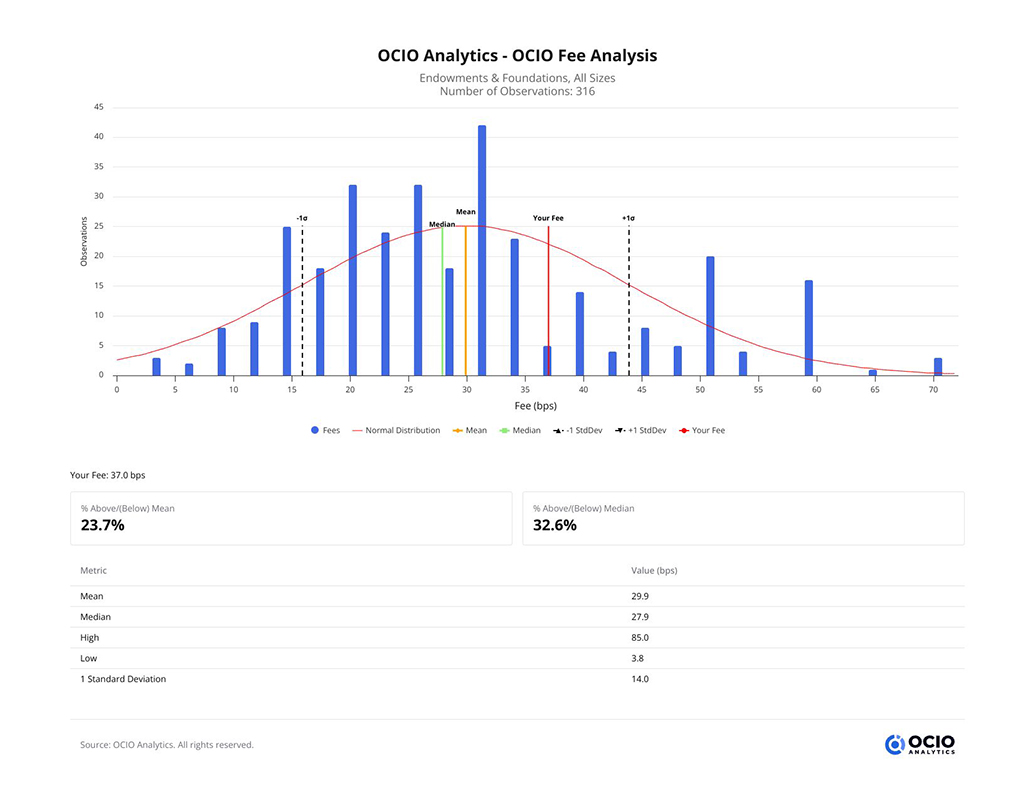
Benchmark OCIO fees based on AUM sizes by using visualizations and key metrics like mean, median, high, low, and standard deviation